05 — Research · NYIT · 2025–
OngoingA New Precedent
Bringing building performance into the architectural precedent study.
The research
A precedent study usually reads a building through its form, plan and materials. This one asks how the building actually performs.
I simulate each precedent in Rhino and ClimateStudio, and designed the template that presents the results.
One board, four lenses
01 — The templateDesign / Construction
- General description
- Spatial design
- Envelope / systems
- Materials / finishes
Climate / Site
- Climate file + zones
- Temp / RH / irradiance / psychrometrics
- Shading / wind
- Site irradiance
Daylight / Glare
- Glare: original vs improved glazing
- Daylighting: sDA, ASE, average lux
- Climate baseline
Energy / Carbon
- Energy use: loads / construction / HVAC
- Total energy + operational carbon: NYC LL97 benchmark
Same board, same order, so any two buildings in the library read side by side.
Farnsworth House
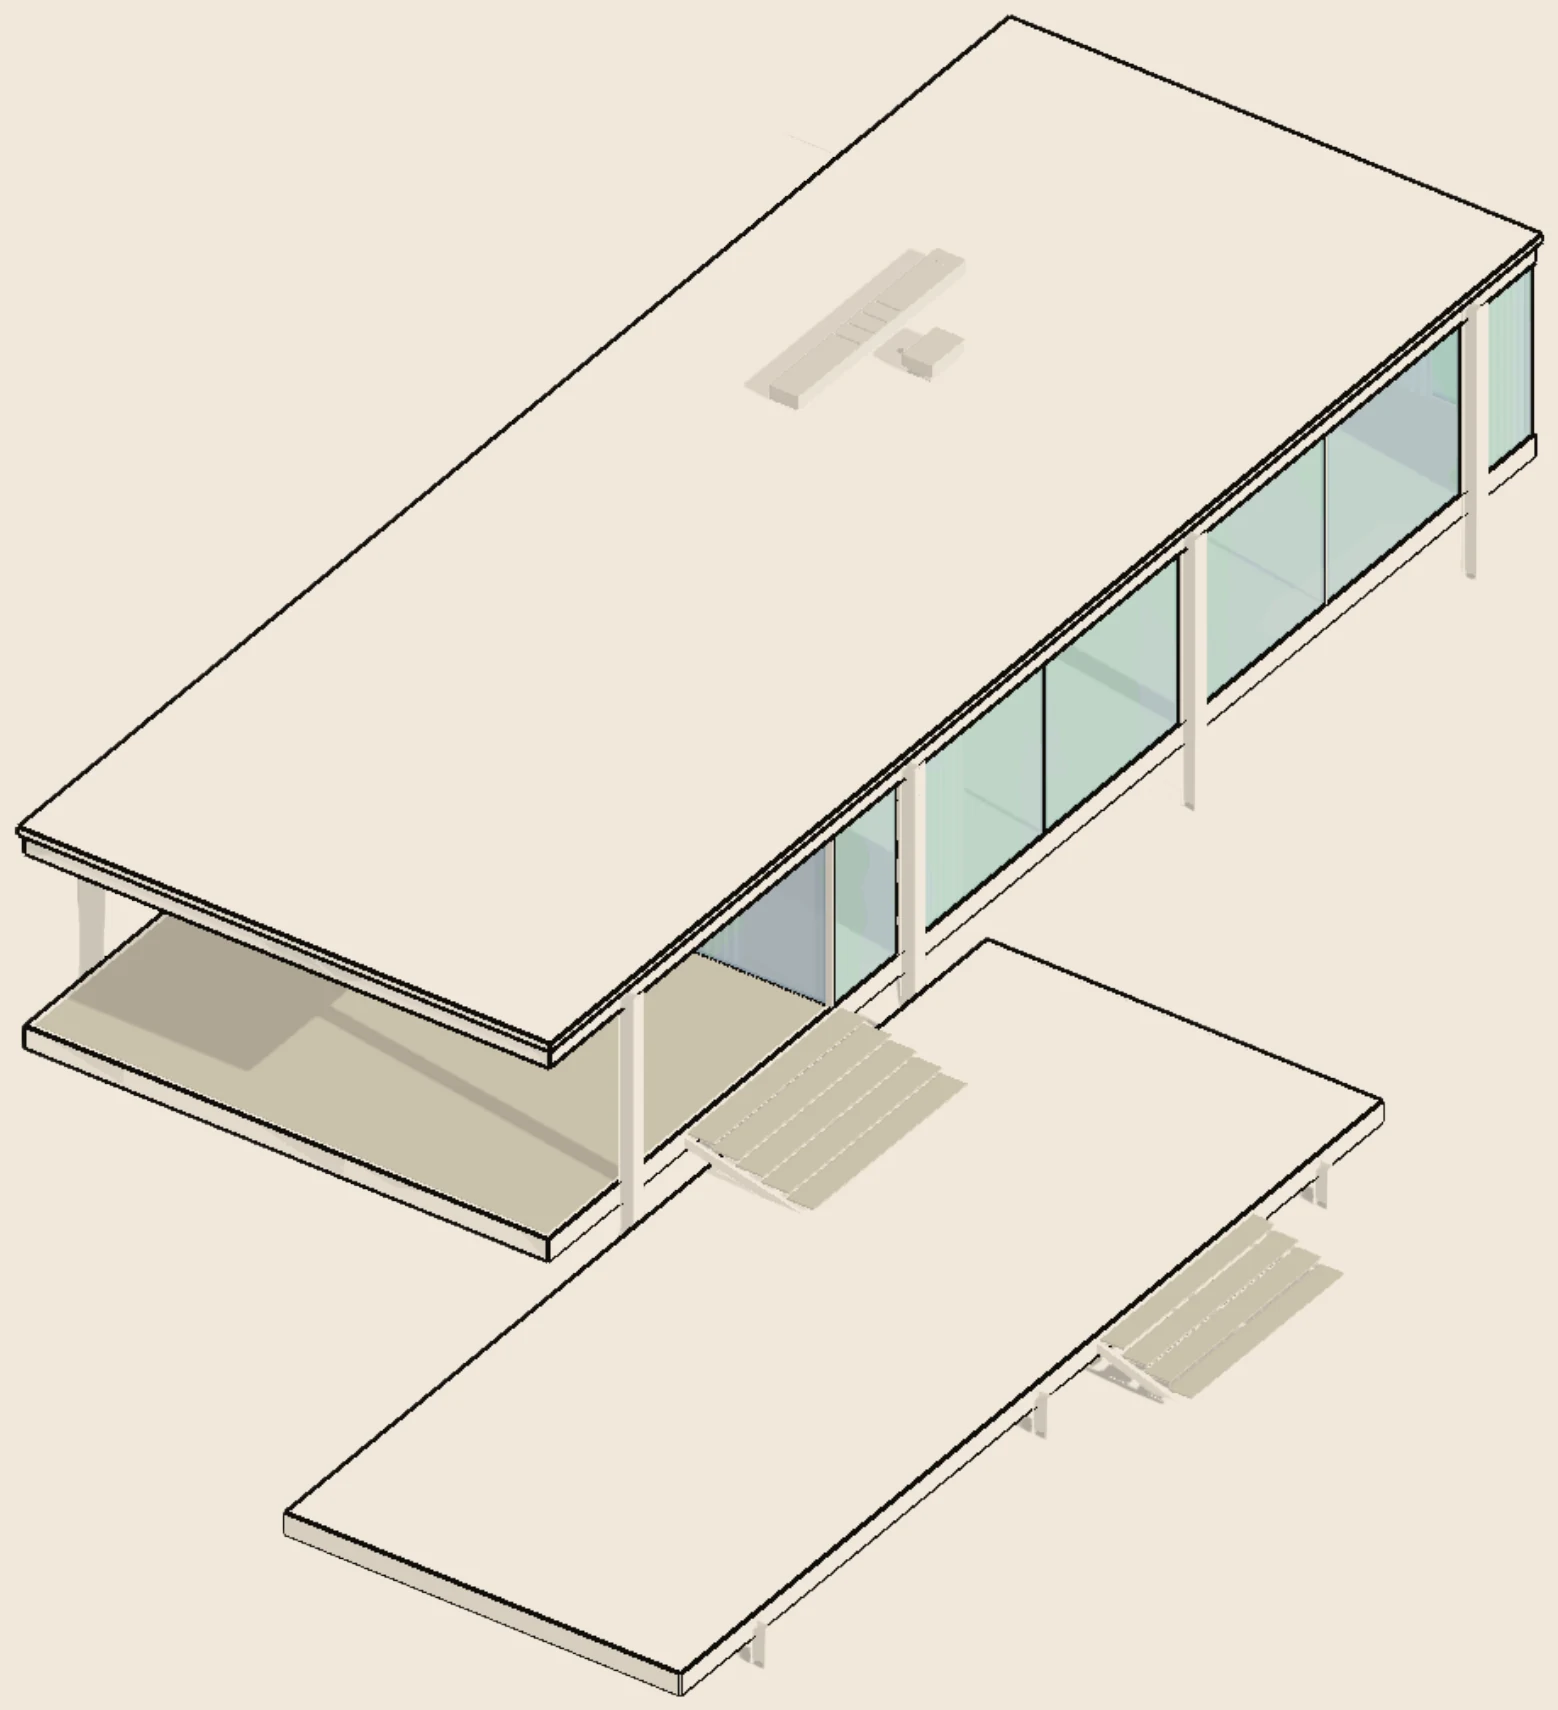
02 — The first precedentThe envelope is a minimal steel-and-glass shell with almost no insulation, air sealing or moisture control. It’s elegant, but systemically fragile.
- Architect
- Ludwig Mies van der Rohe
- Location
- Plano, Illinois
- Completed
- 1951
- Climate
- ASHRAE 5A
Climate and site
03 — Shading, wind and site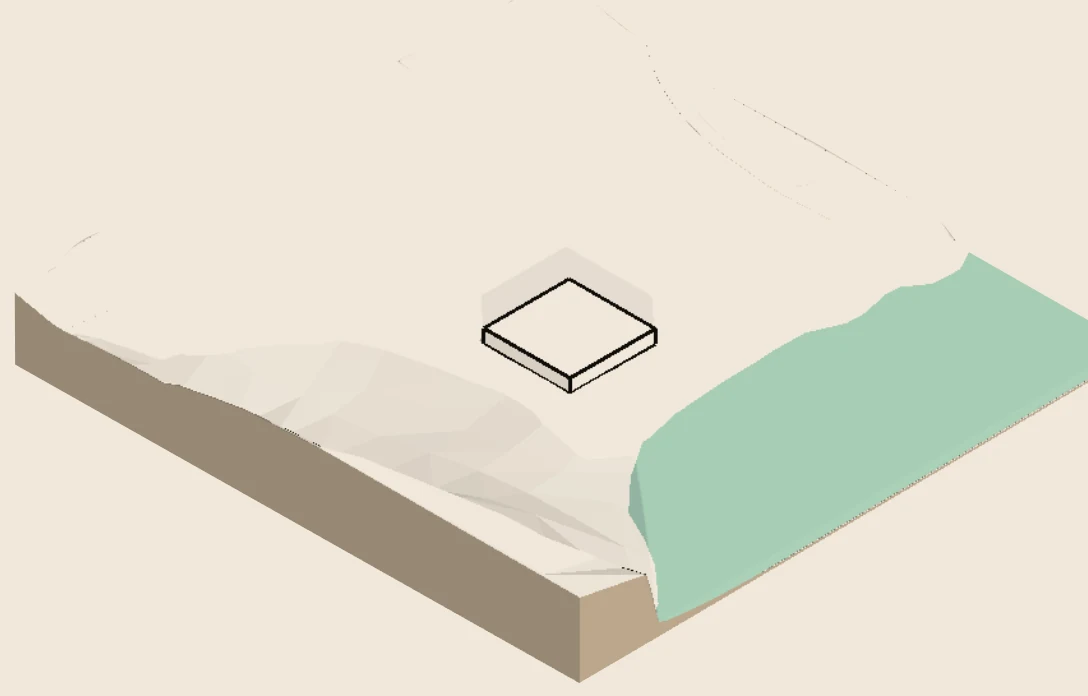
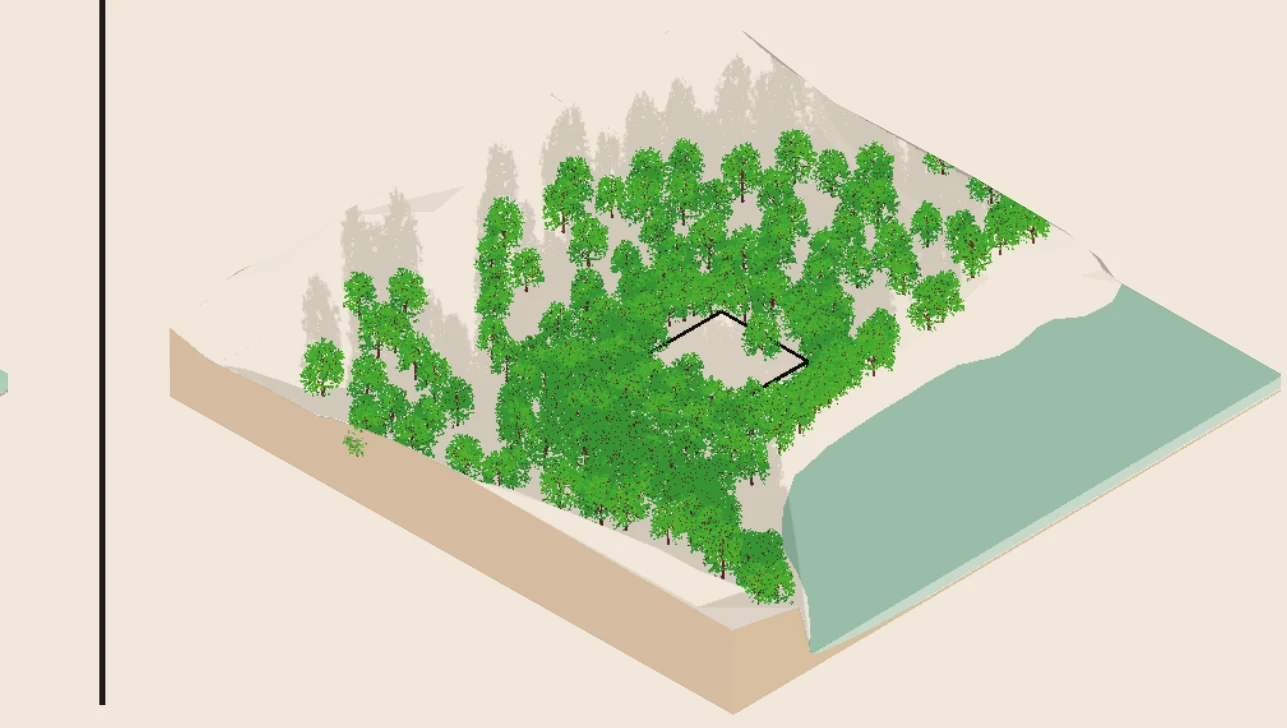
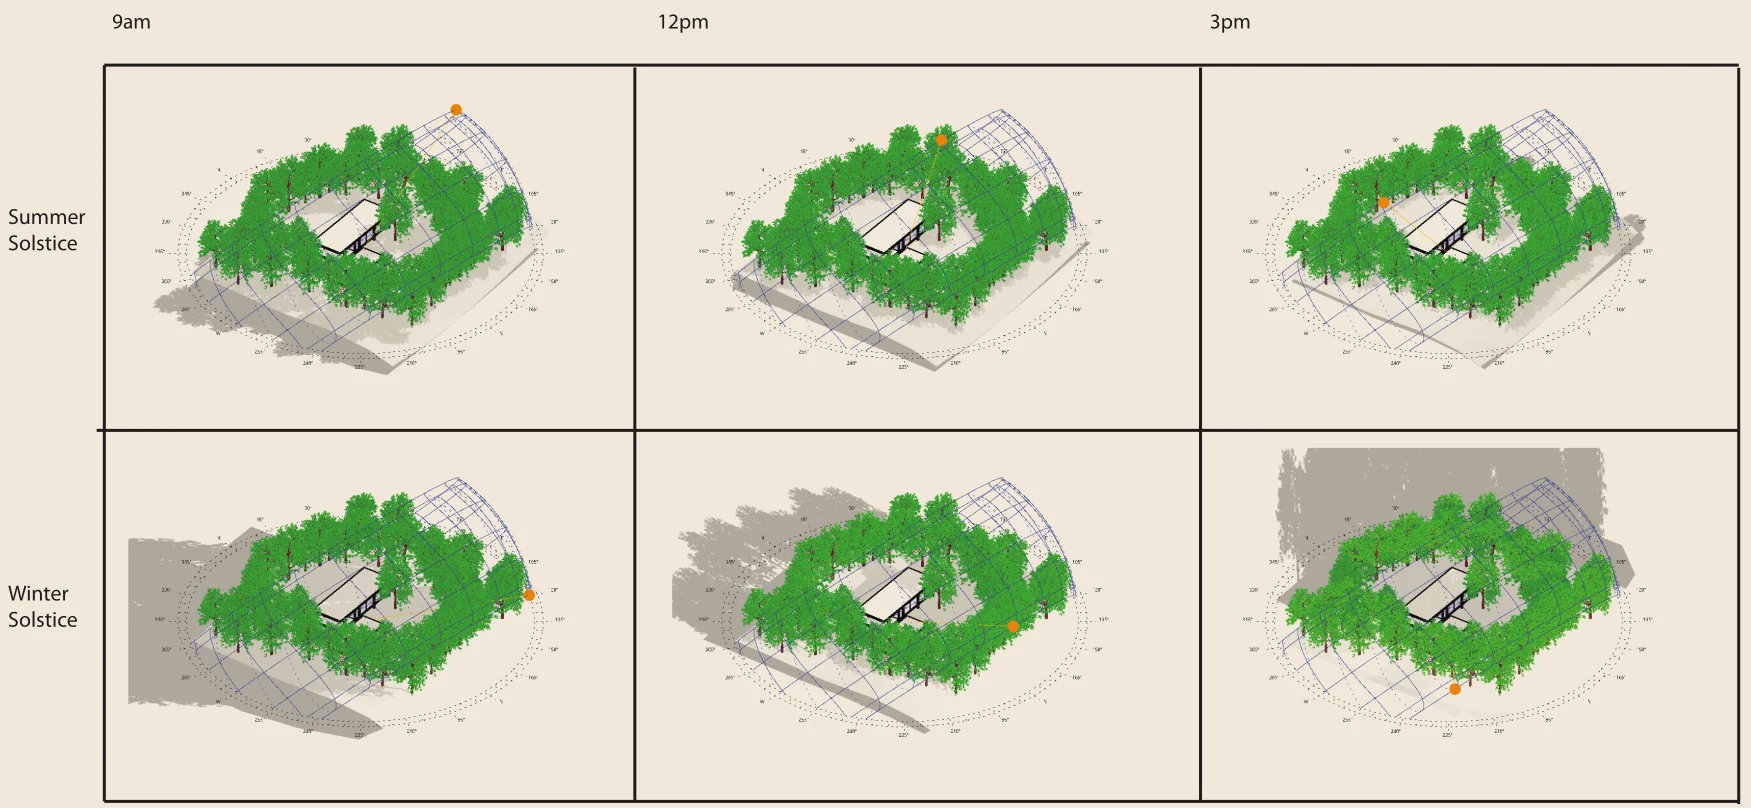
Deep summer shade, full winter sun
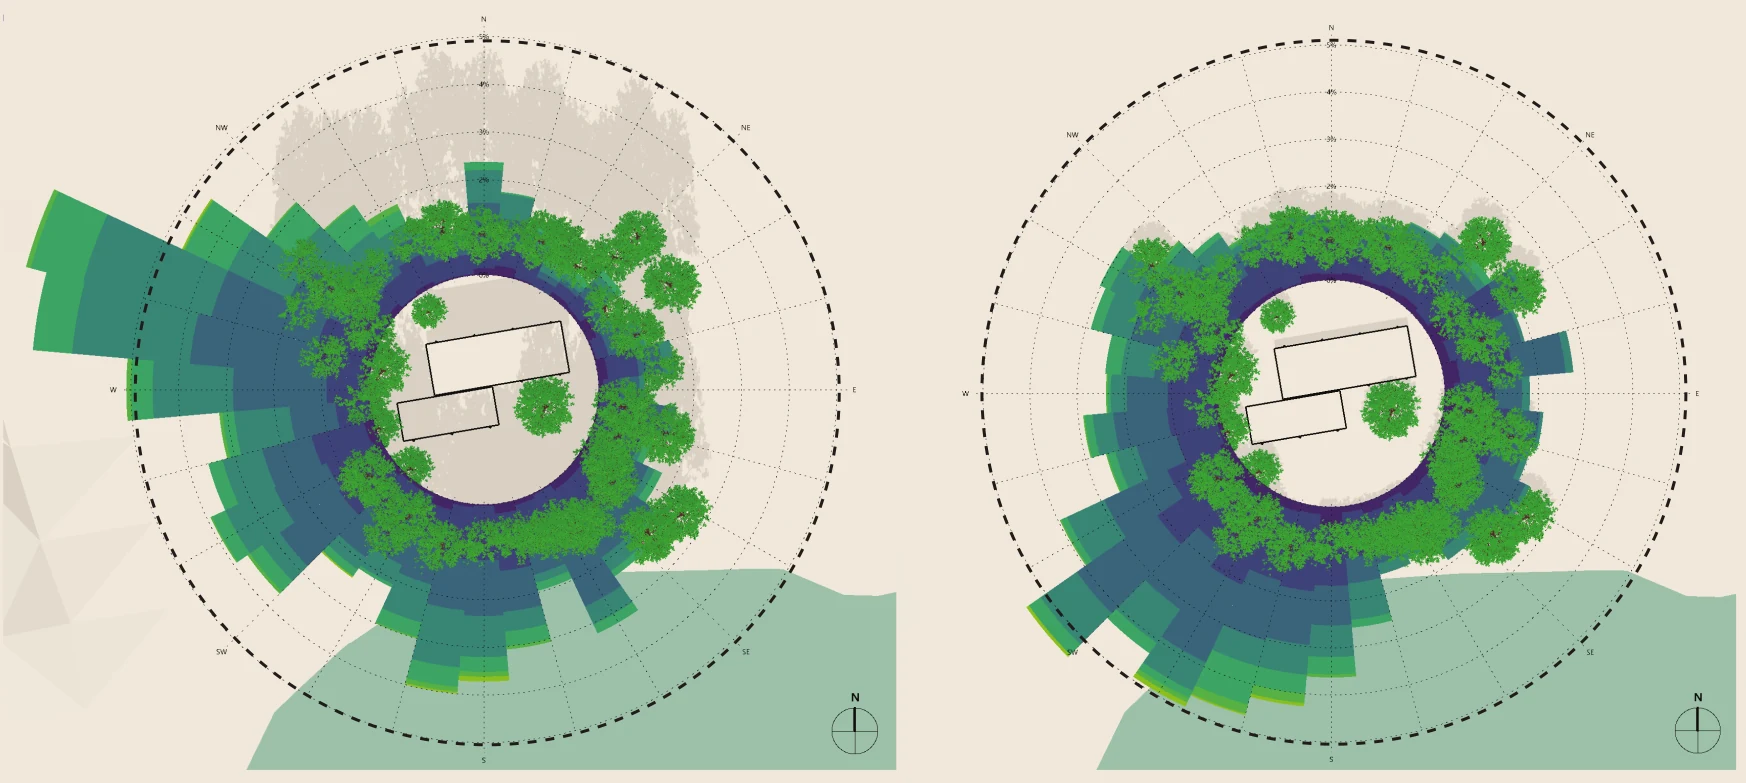
Wind follows the river
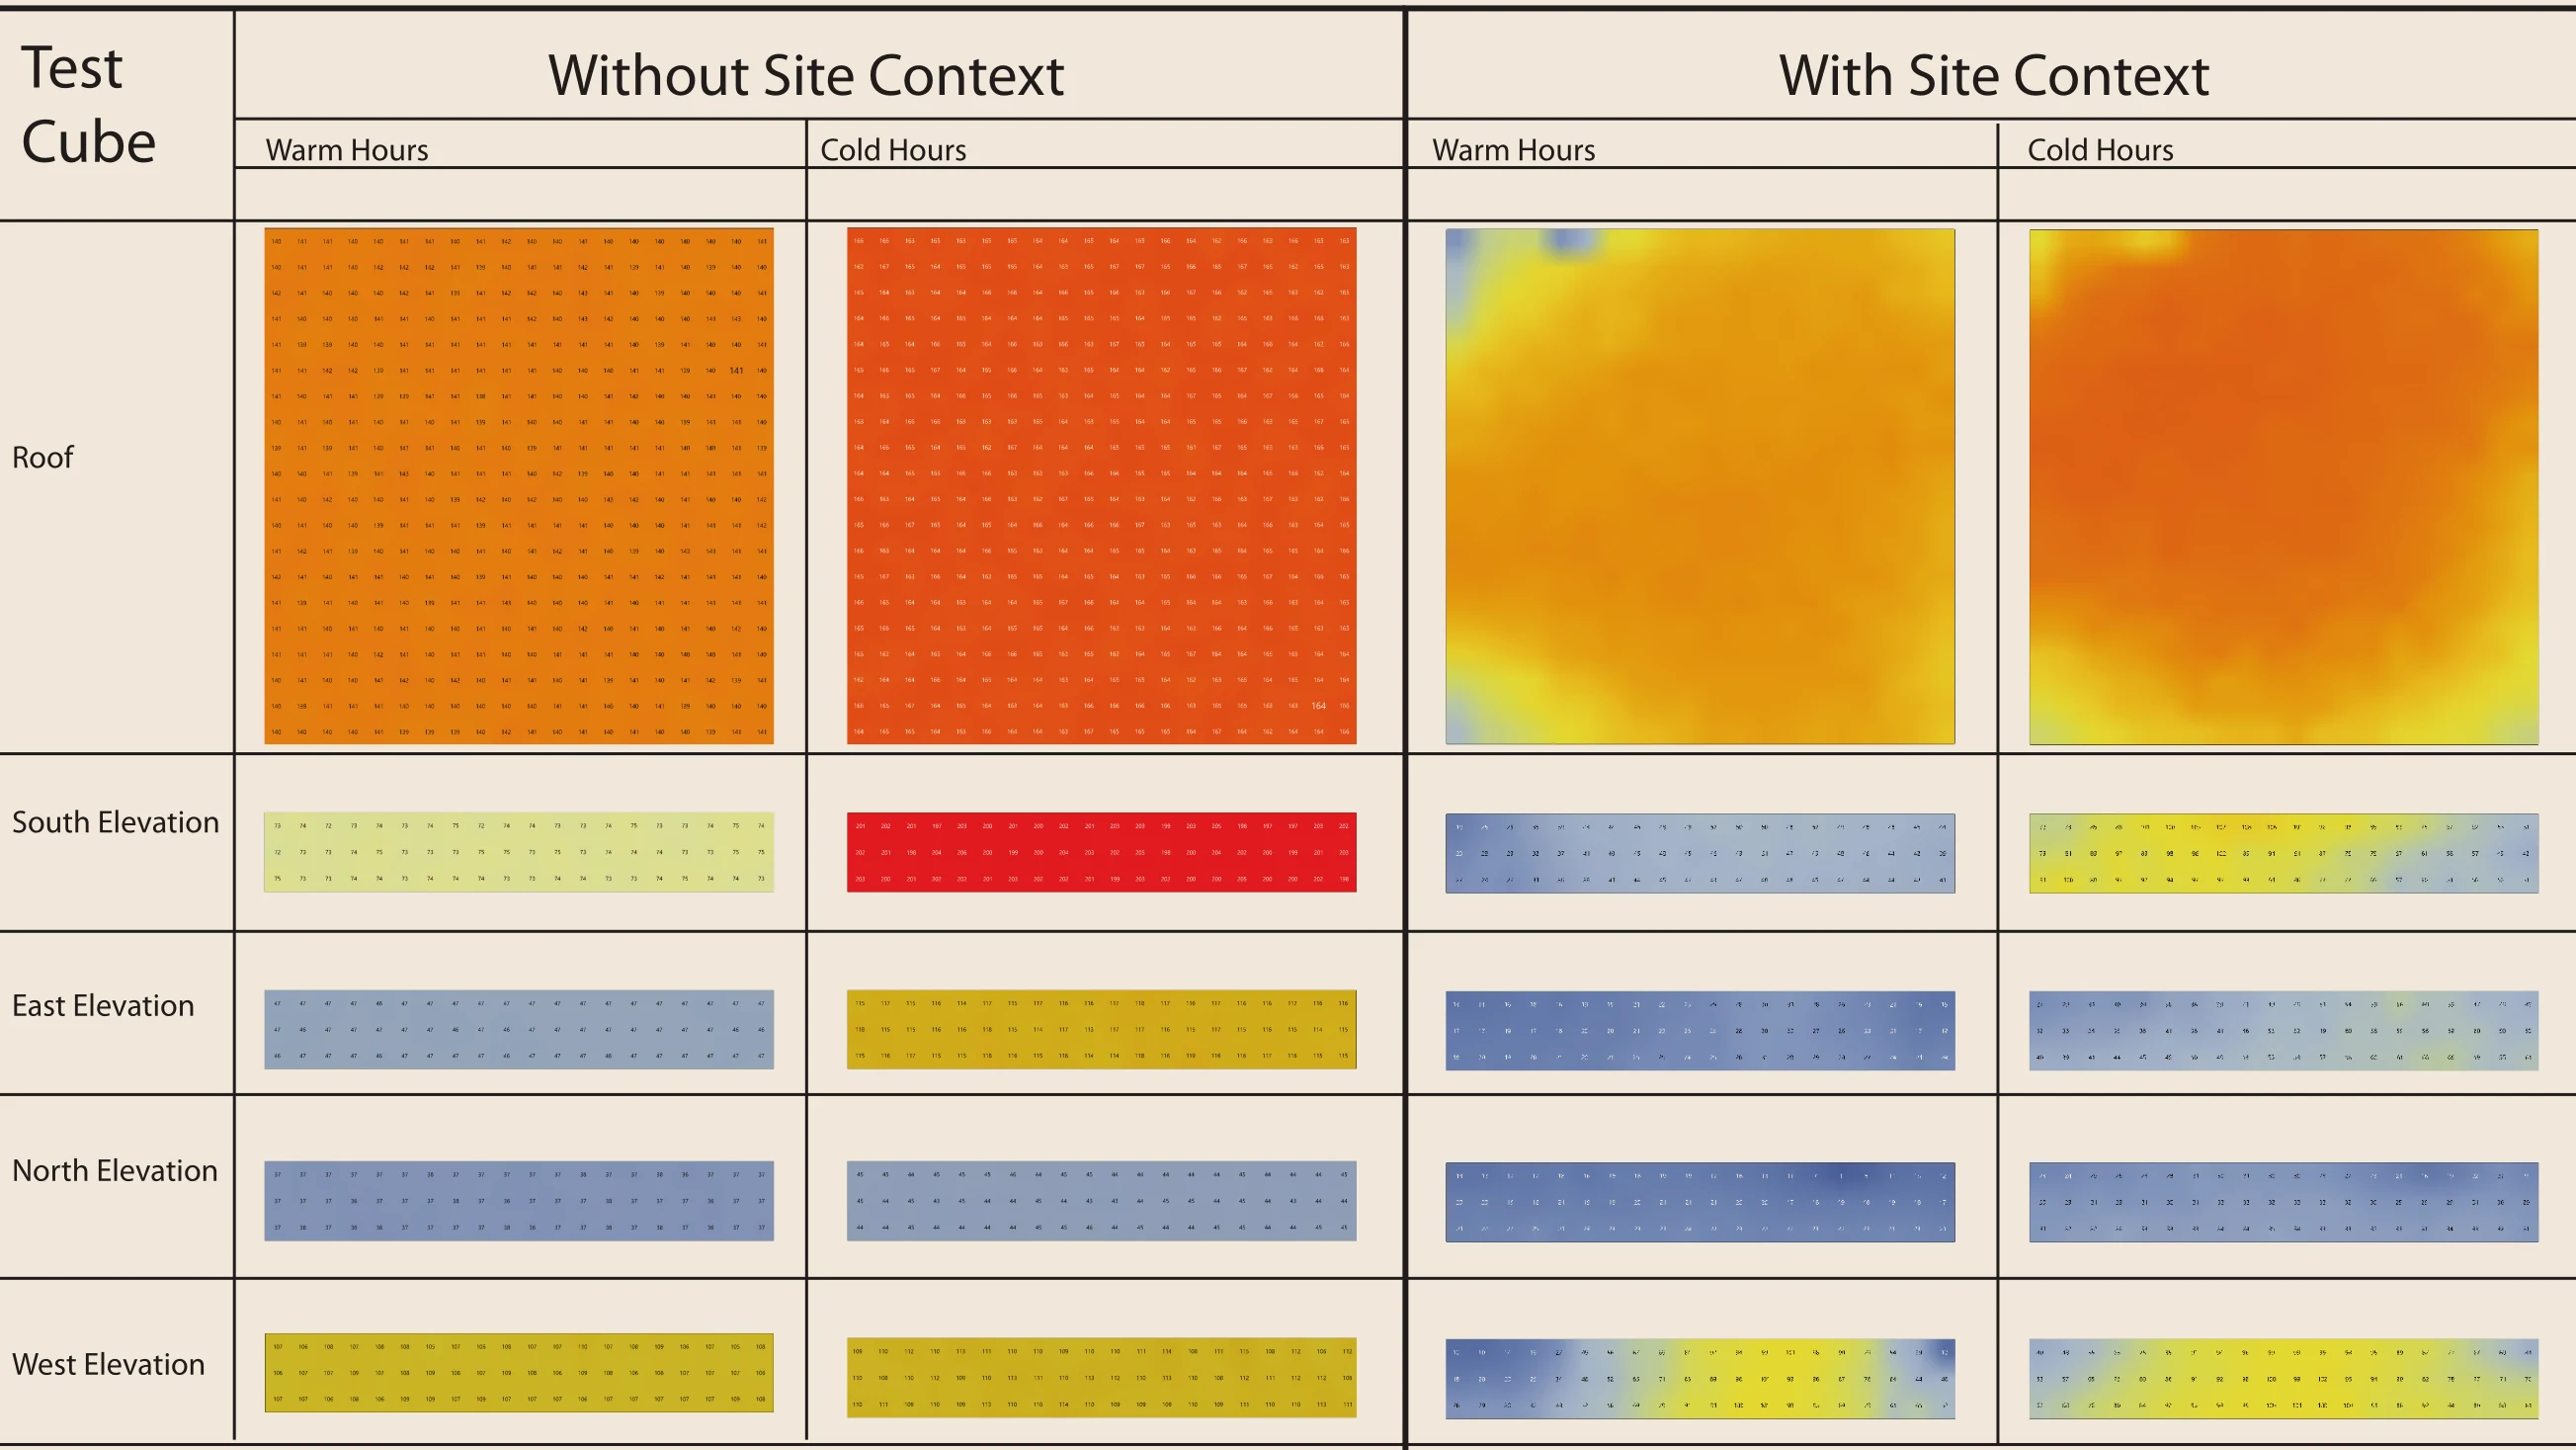
Sun on the envelope
04 — Site irradianceThe roof takes high winter sun because the leaf-off forest lets it through. In summer the canopy cuts irradiance on every façade, leaving the west side with moderate afternoon gain.
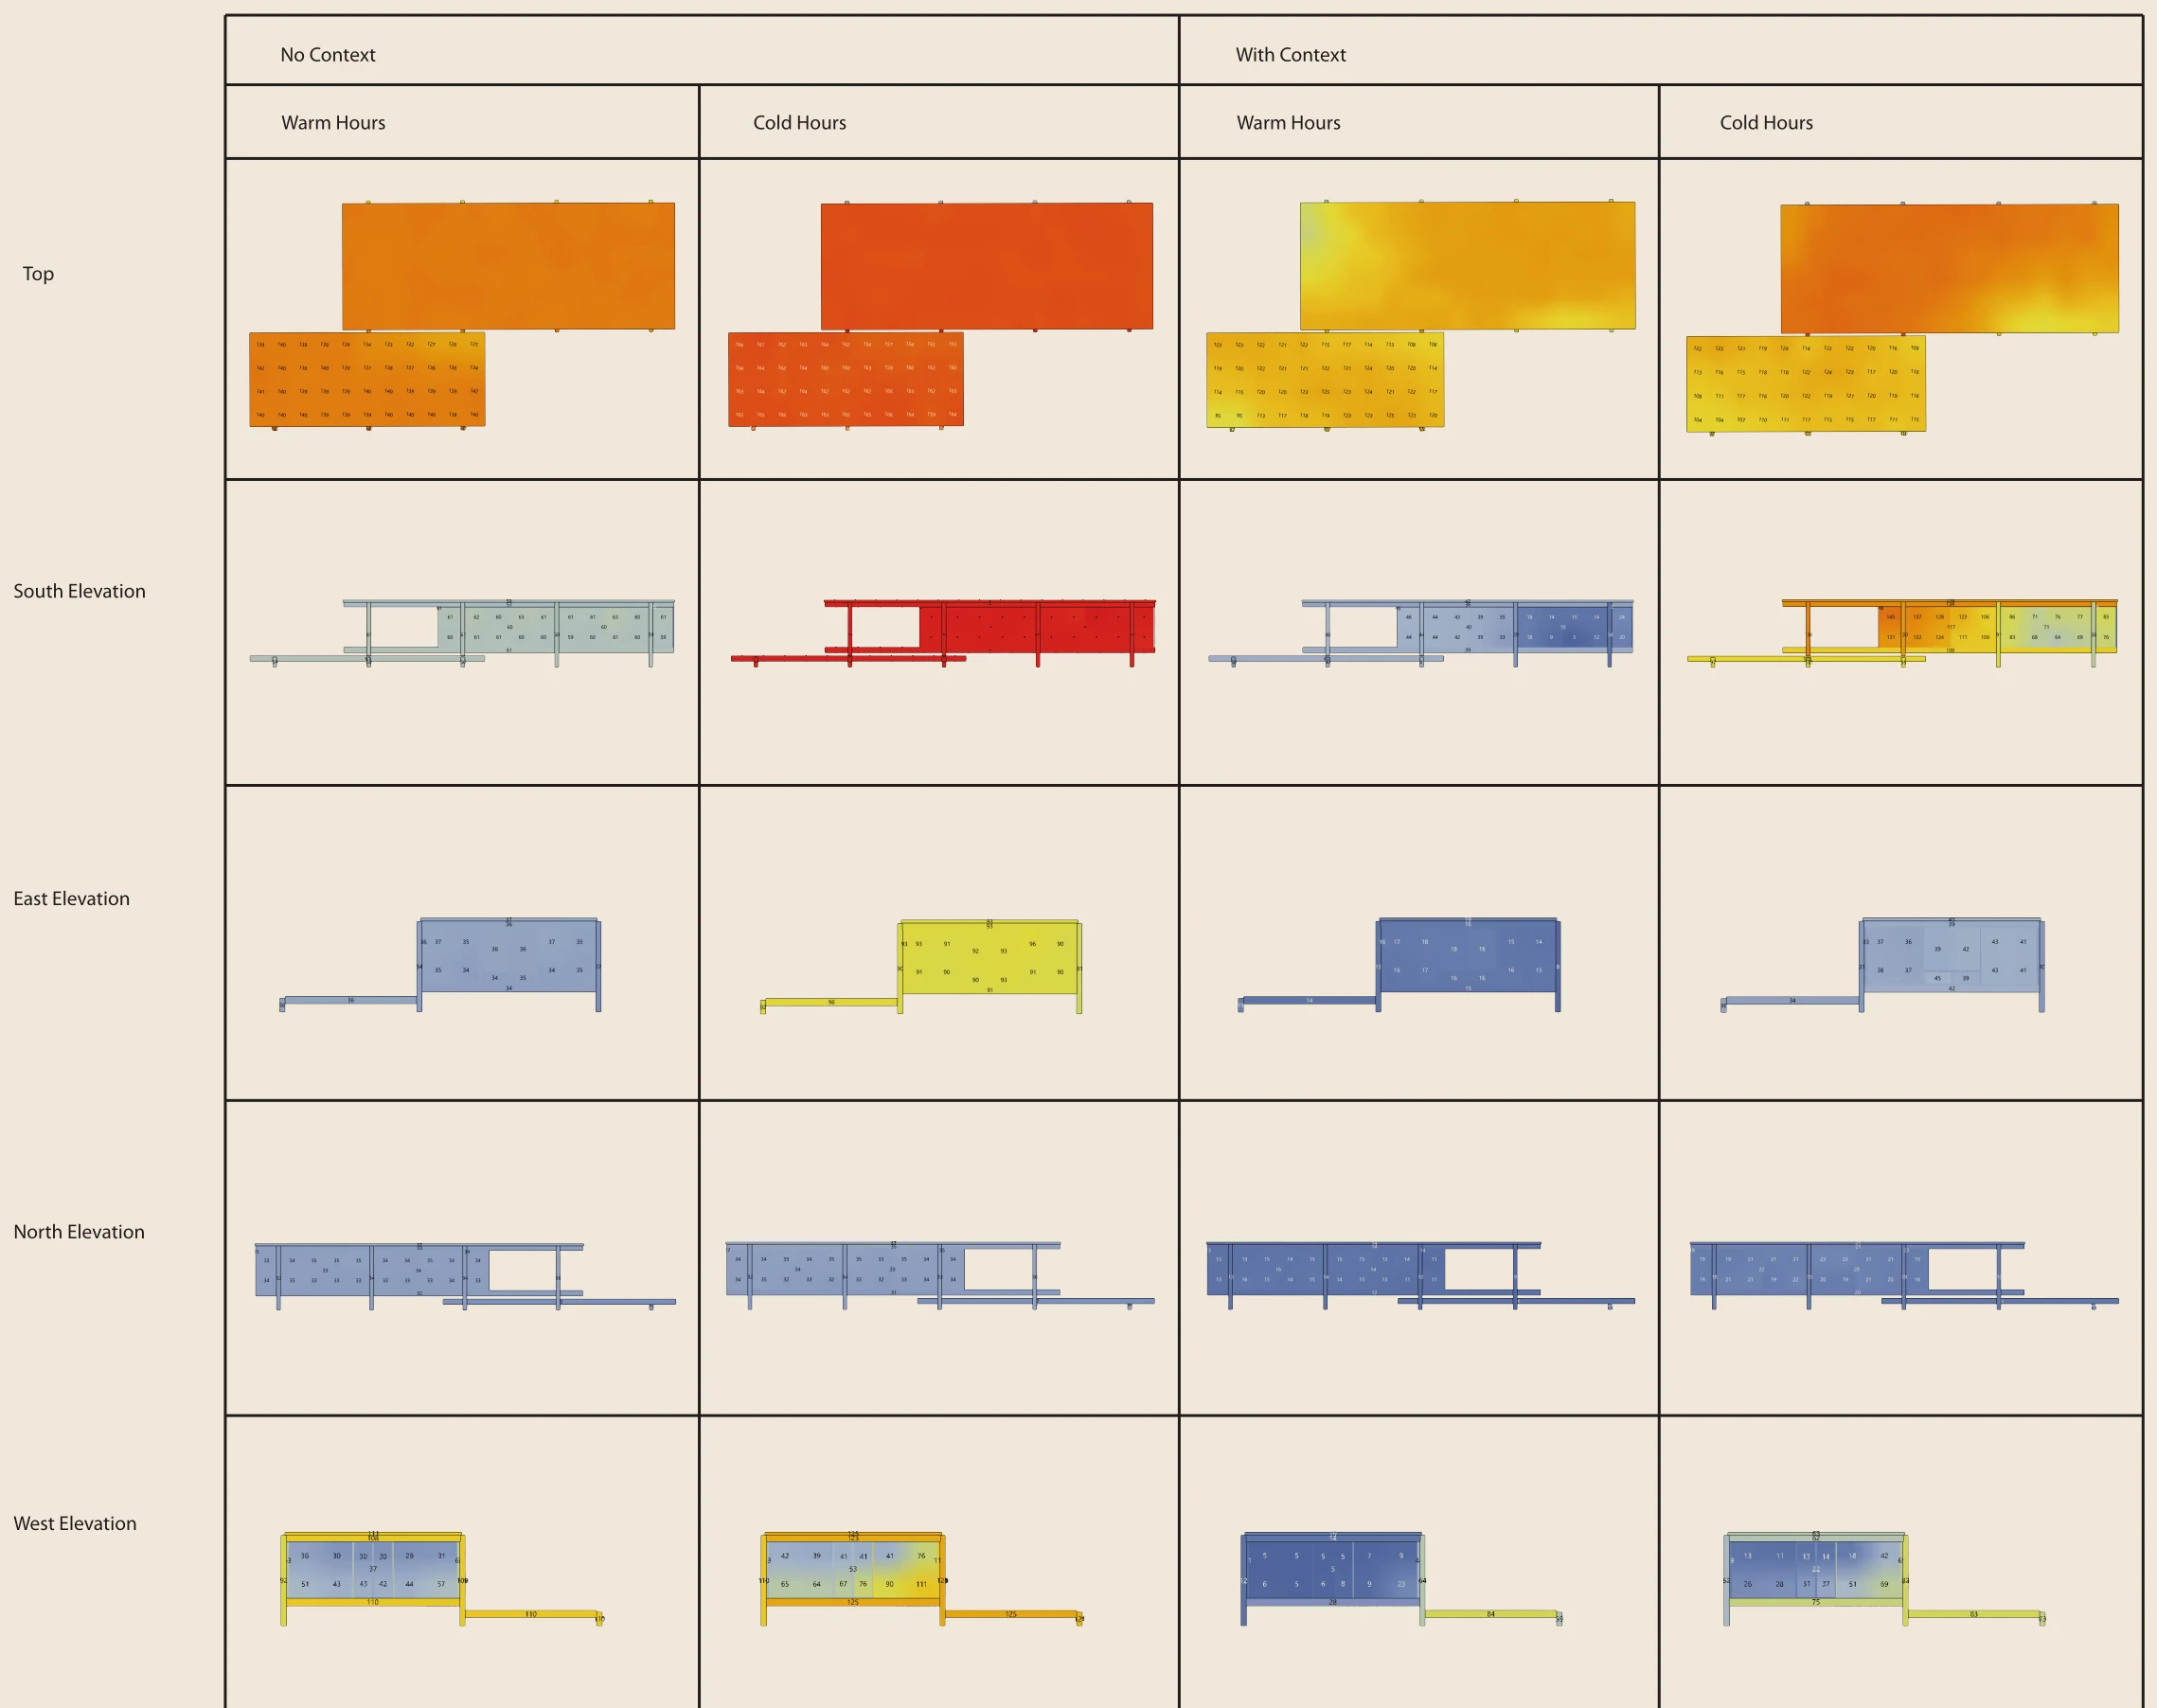
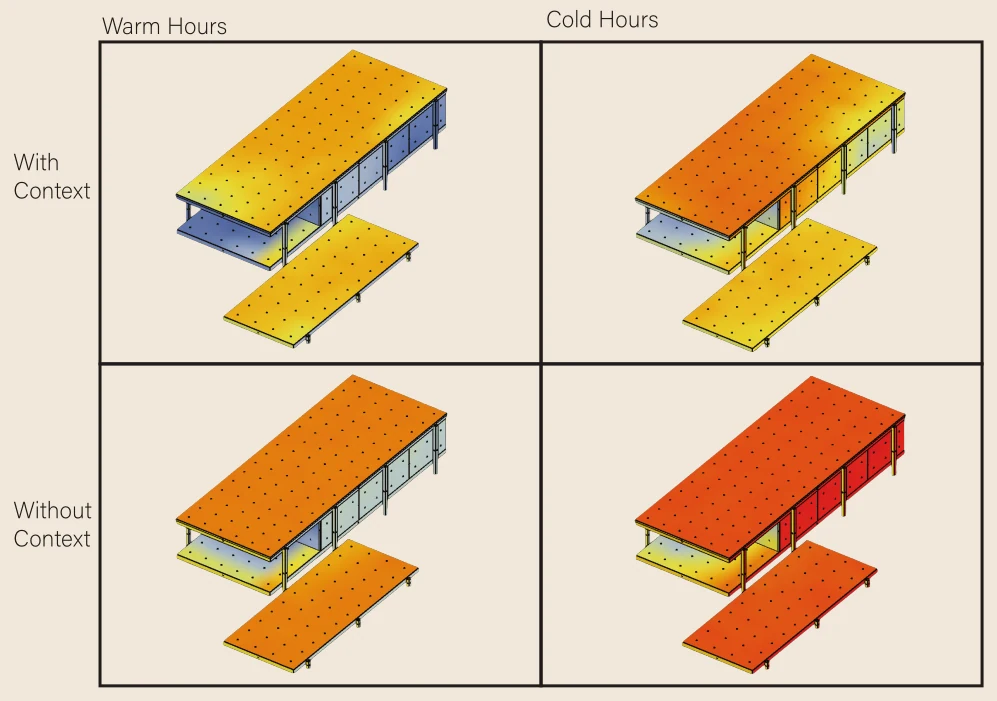

Scale: 0–200 kBTU/ft².
Daylight and glare
05 — Daylight / glare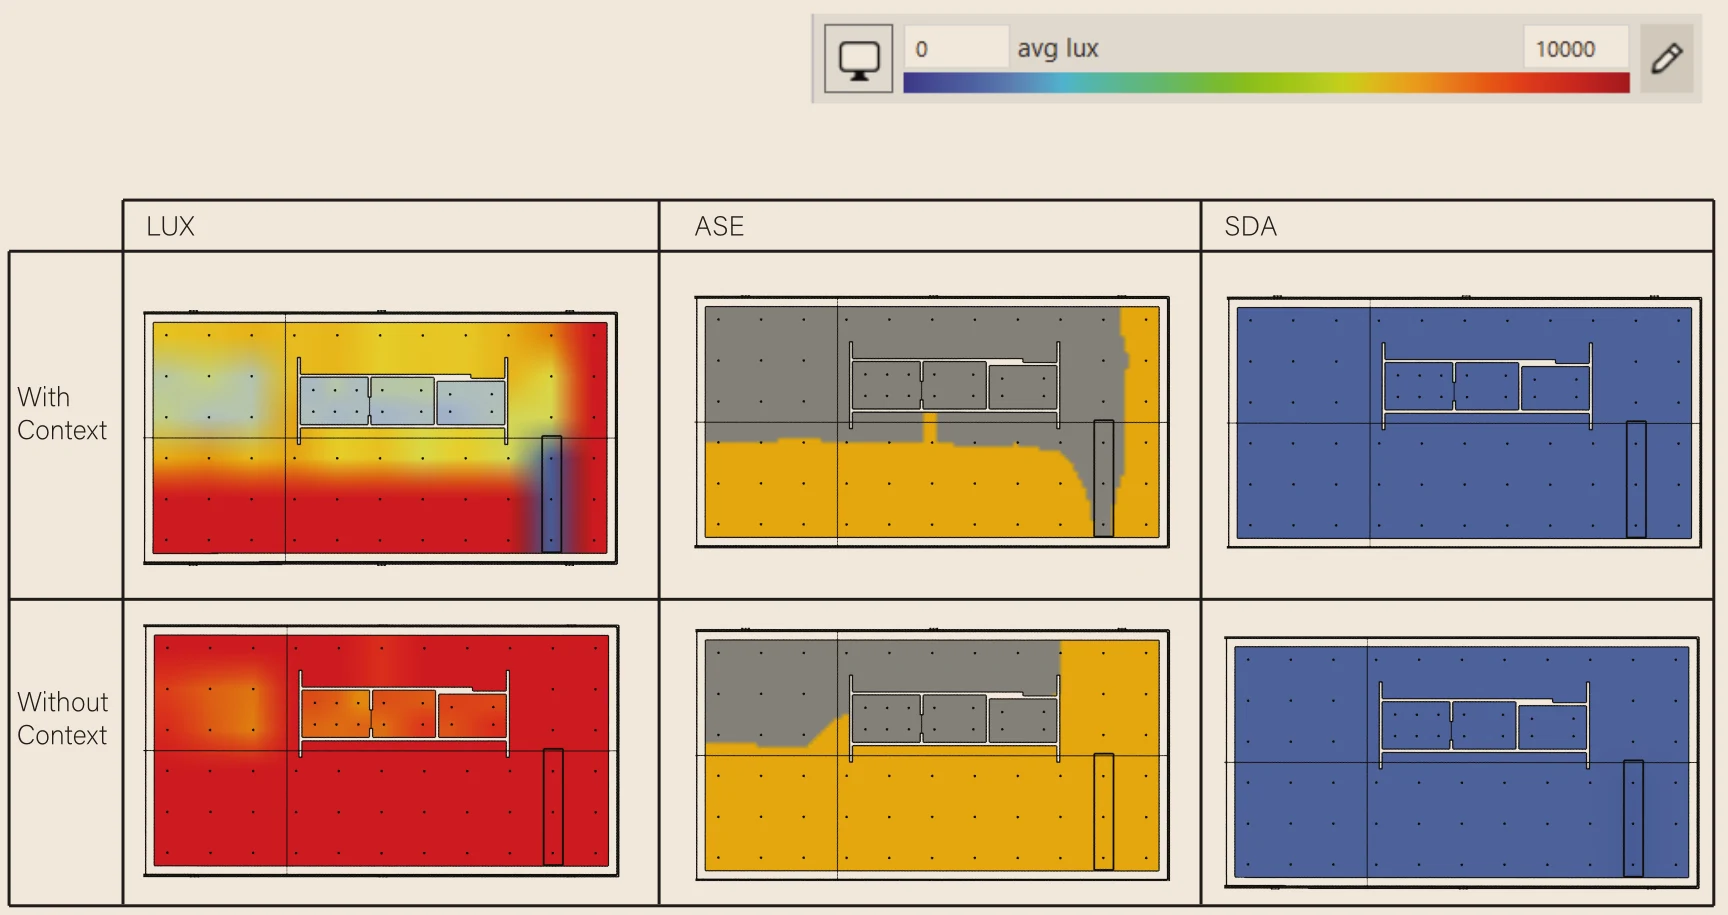
A glass box, flooded with light
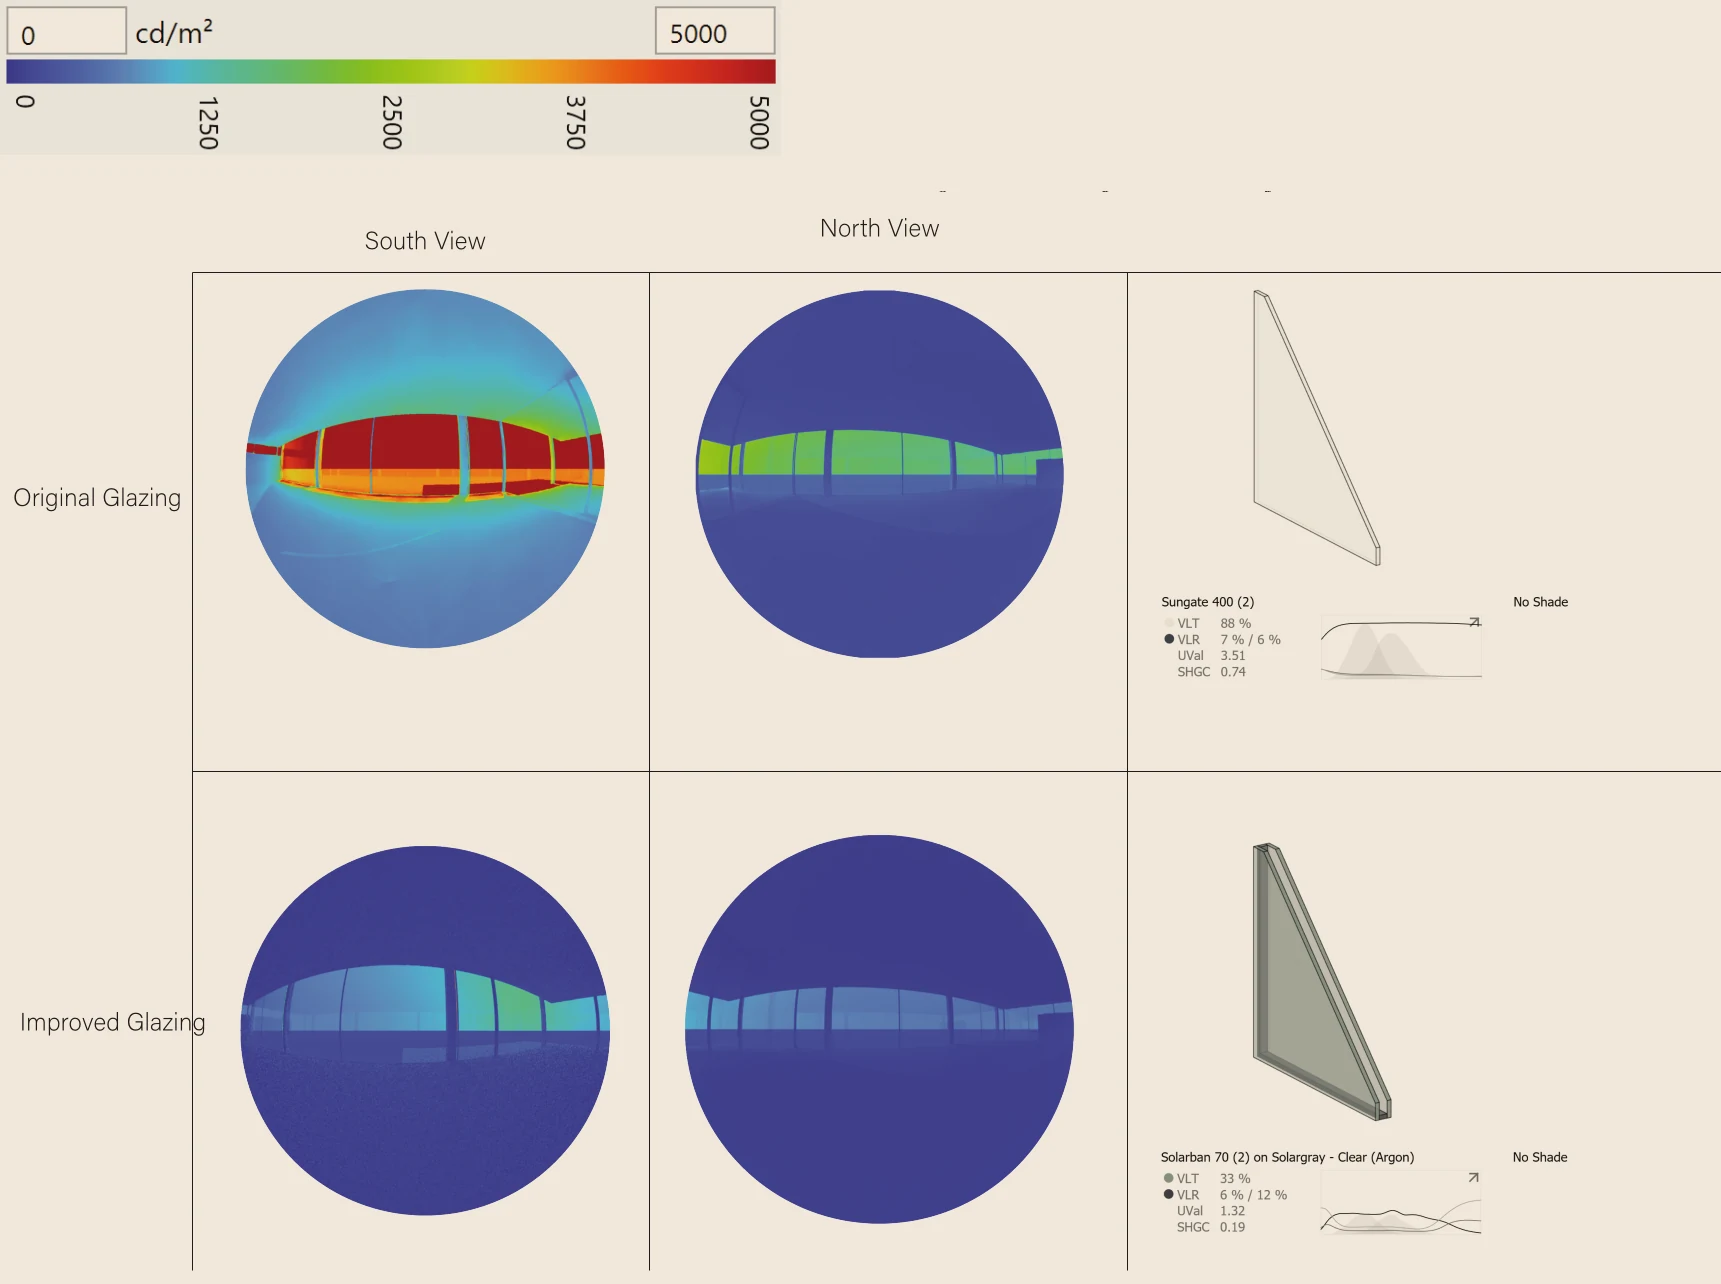
Swapping the glass cuts solar gain by three-quarters
Energy and carbon
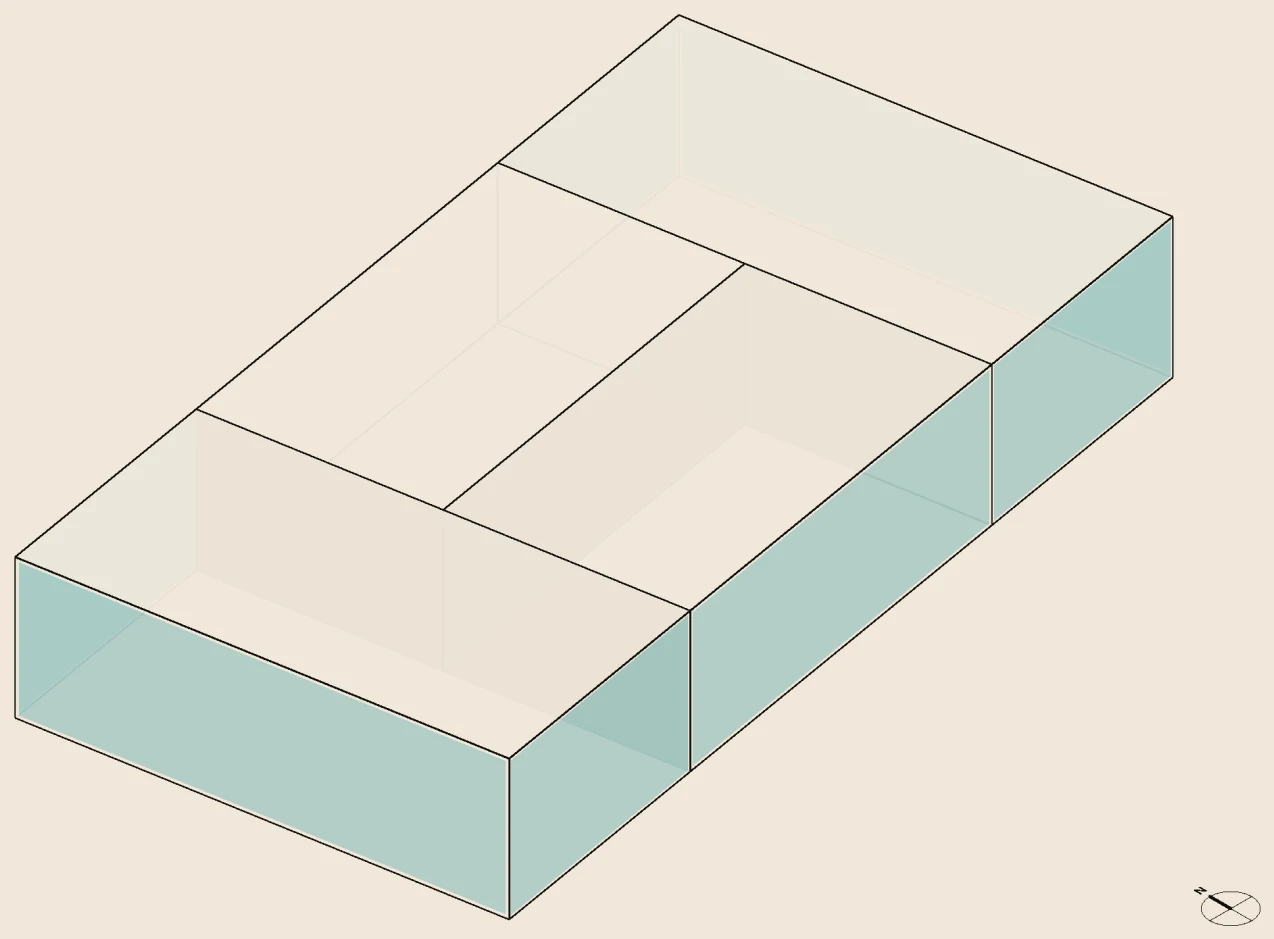
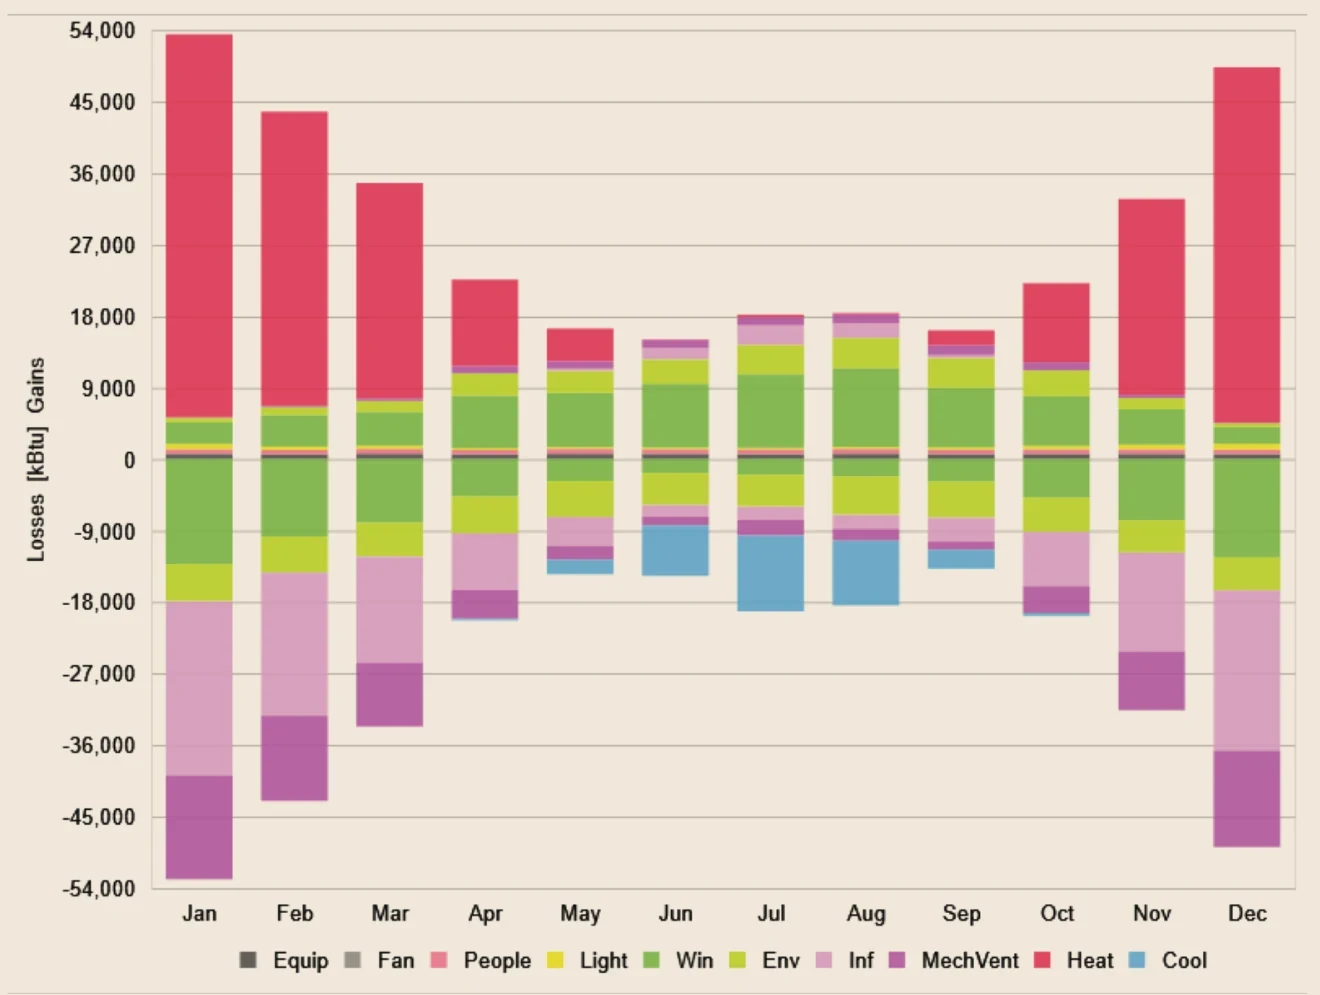
06 — Energy useModeled as four perimeter zones, the house uses about twice its baseline energy per square foot, and heating dominates from November to March.